实验的所有代码都放在了github,这个链接:
Akabane71/triton-learn-note: 记录一下自己的学习triton推理服务
需求
研究一下怎么将AI后端服务规模化,不再是 FastAPI + Pytorch 的手动演示模式
Triton Inference Server 推理服务框架
还有一个叫OpenAI Triton 这个不是应用层,那个是更底层的东西
- Triton Inference Server 推理服务框架
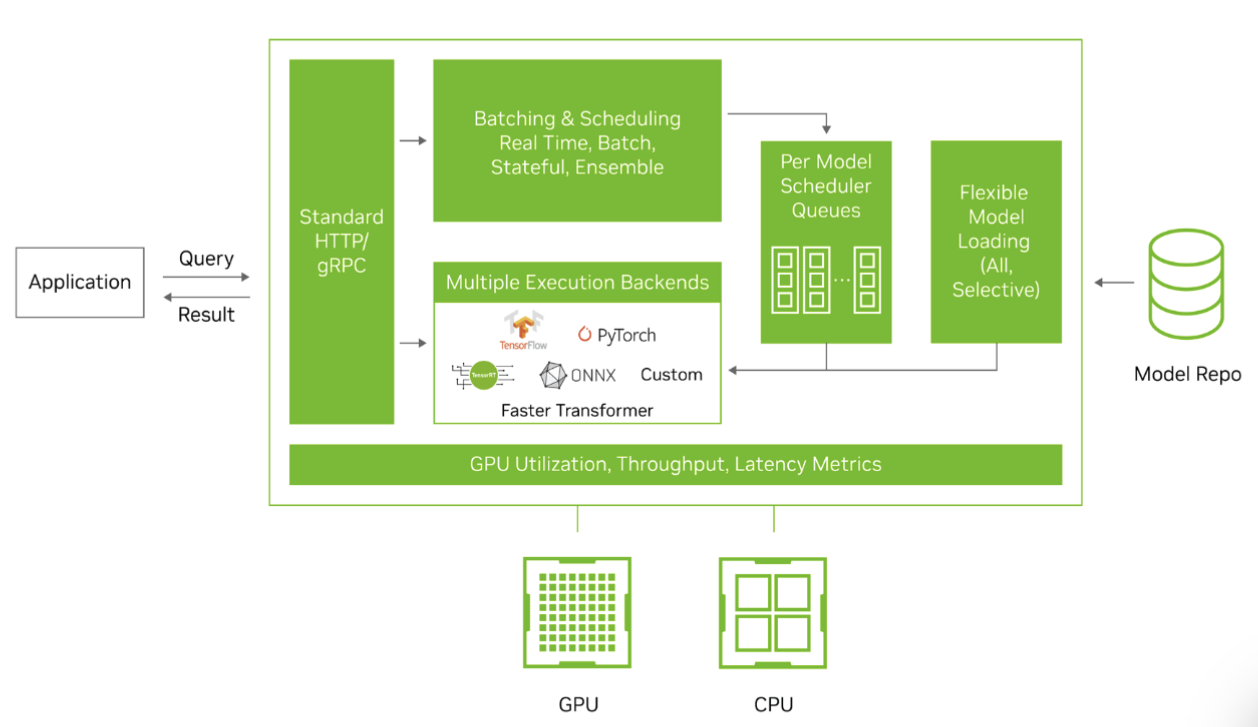
Triton 支持 TensorRT,ONNX,C++,Python等后端推理,尤其Python和C++后端,可以兼容很多算法,只需要写好自定义的model文件即可
具体的介绍文档
环境准备
测试环境 Tesla T4 ,显卡驱动版本为: 575.64.03 ,最高支持的cuda版本为 12.9 /13.0
先配置一下将gpu性能拉满:
sudo nvidia-smi -pm 1
docker部署环境
查看 NV 的镜像位置
镜像里面的相关信息,查看文档
比较新的版本 25.08,版本为 cuda 13.0
# py & triton-server
docker pull nvcr.io/nvidia/tritonserver:25.08-py3

# py & trt
docker pull nvcr.io/nvidia/tensorrt:25.08-py3

# py & sdk 携带了测试工具
docker pull nvcr.io/nvidia/tritonserver:25.08-py3-sdk
这个cuda版本太新了,后续实验的 faster-whisper 不支持
改用这个版本 nvcr.io/nvidia/tritonserver:25.03-py3,cuda为 12.8x
# py & triton-server ----> 携带py后端的 triton
docker pull nvcr.io/nvidia/tritonserver:25.03-py3

# py & trt ---> 携带py的tensorRT,用来编译
docker pull nvcr.io/nvidia/tensorrt:25.03-py3

# py & triton-server & perf_analyzer 性能测试工具 & py-sdk
docker pull nvcr.io/nvidia/tritonserver:25.03-py3-sdk
NV驱动更新
镜像比较大,耐心下载

Triton Inference Server 官方案例
GitHub官方地址:
自己部署案例
直接使用 yolov11-thiny 目标检测模型推理的效果:

yolo系列 [onnx + trt]
triton目录
编写 triton 文件,目录文件呈这样 主要是 onnx 和 trt,以及不同的模型大小
model_repository/
├── yolov11_tiny_onnx
│   ├── 1
│   │   └── model.onnx
│   └── config.pbtxt
├── yolov11_tiny_trt
│   ├── 1
│   │   └── model.plan
│   └── config.pbtxt
├── yolov11_x_onnx
│   ├── 1
│   │   └── model.onnx
│   └── config.pbtxt
└── yolov11_x_trt
    ├── 1
    │   └── model.plan
    └── config.pbtxt
请务必满足上述的命名规范,
onnx模型为 model.onnx
tensorRT模型则为 model.plan
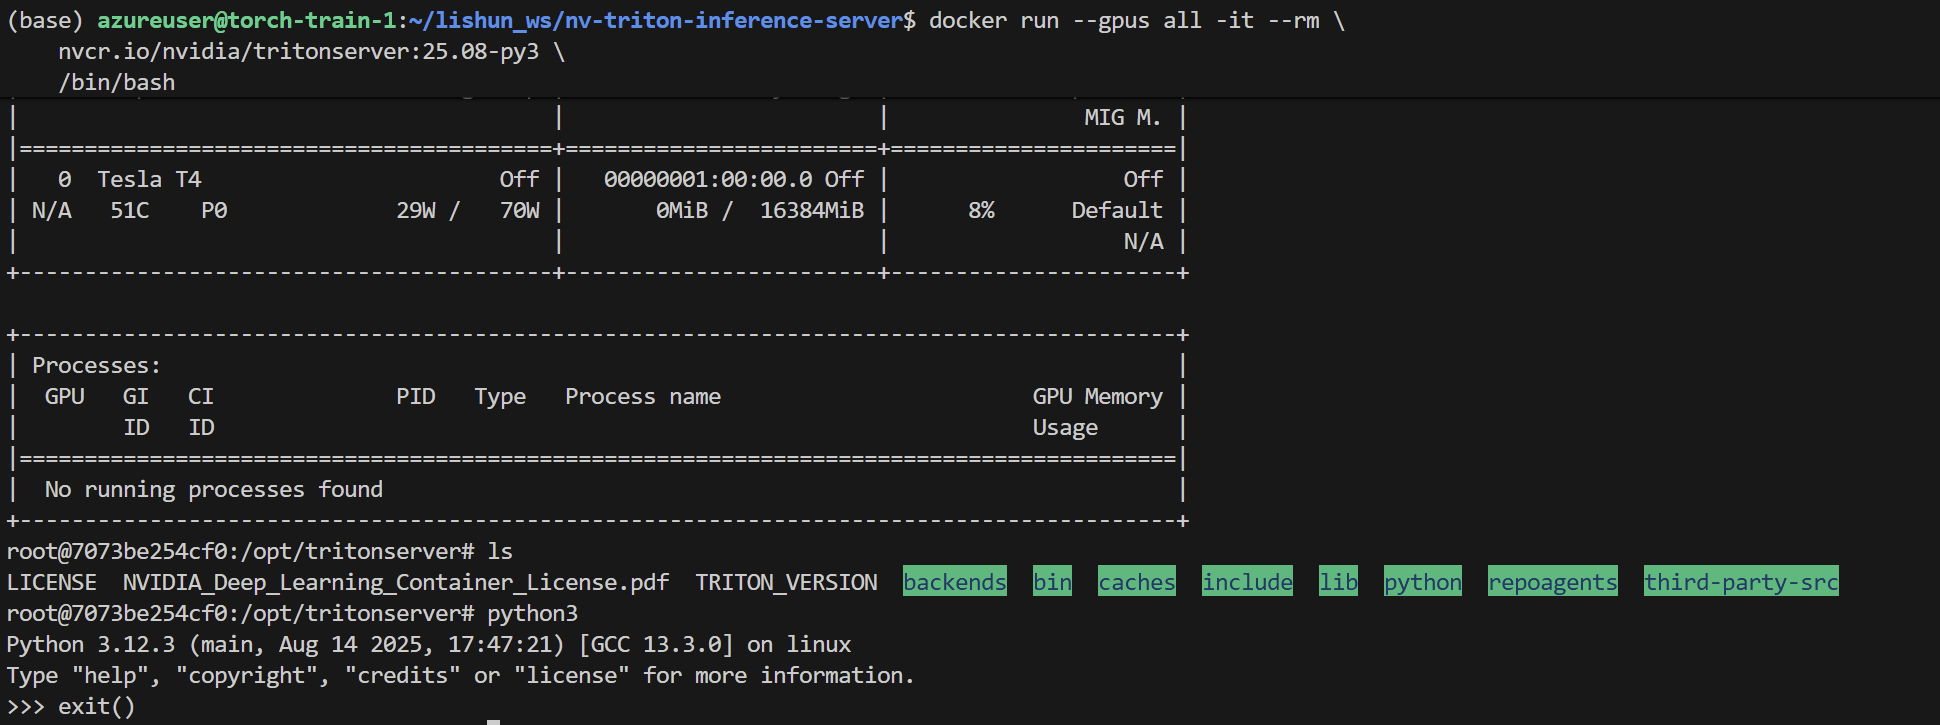
启动服务
docker run --gpus all --rm -it \
  -p8000:8000 -p8001:8001 -p8002:8002 \
  -v $(pwd)/model_repository:/models \
  nvcr.io/nvidia/tritonserver:25.08-py3 \
  tritonserver --model-repository=/models
Triton 客户端:
triton_client.py
https://github.com/Akabane71/triton-learn-note/blob/main/yolo-project/triton-client.py
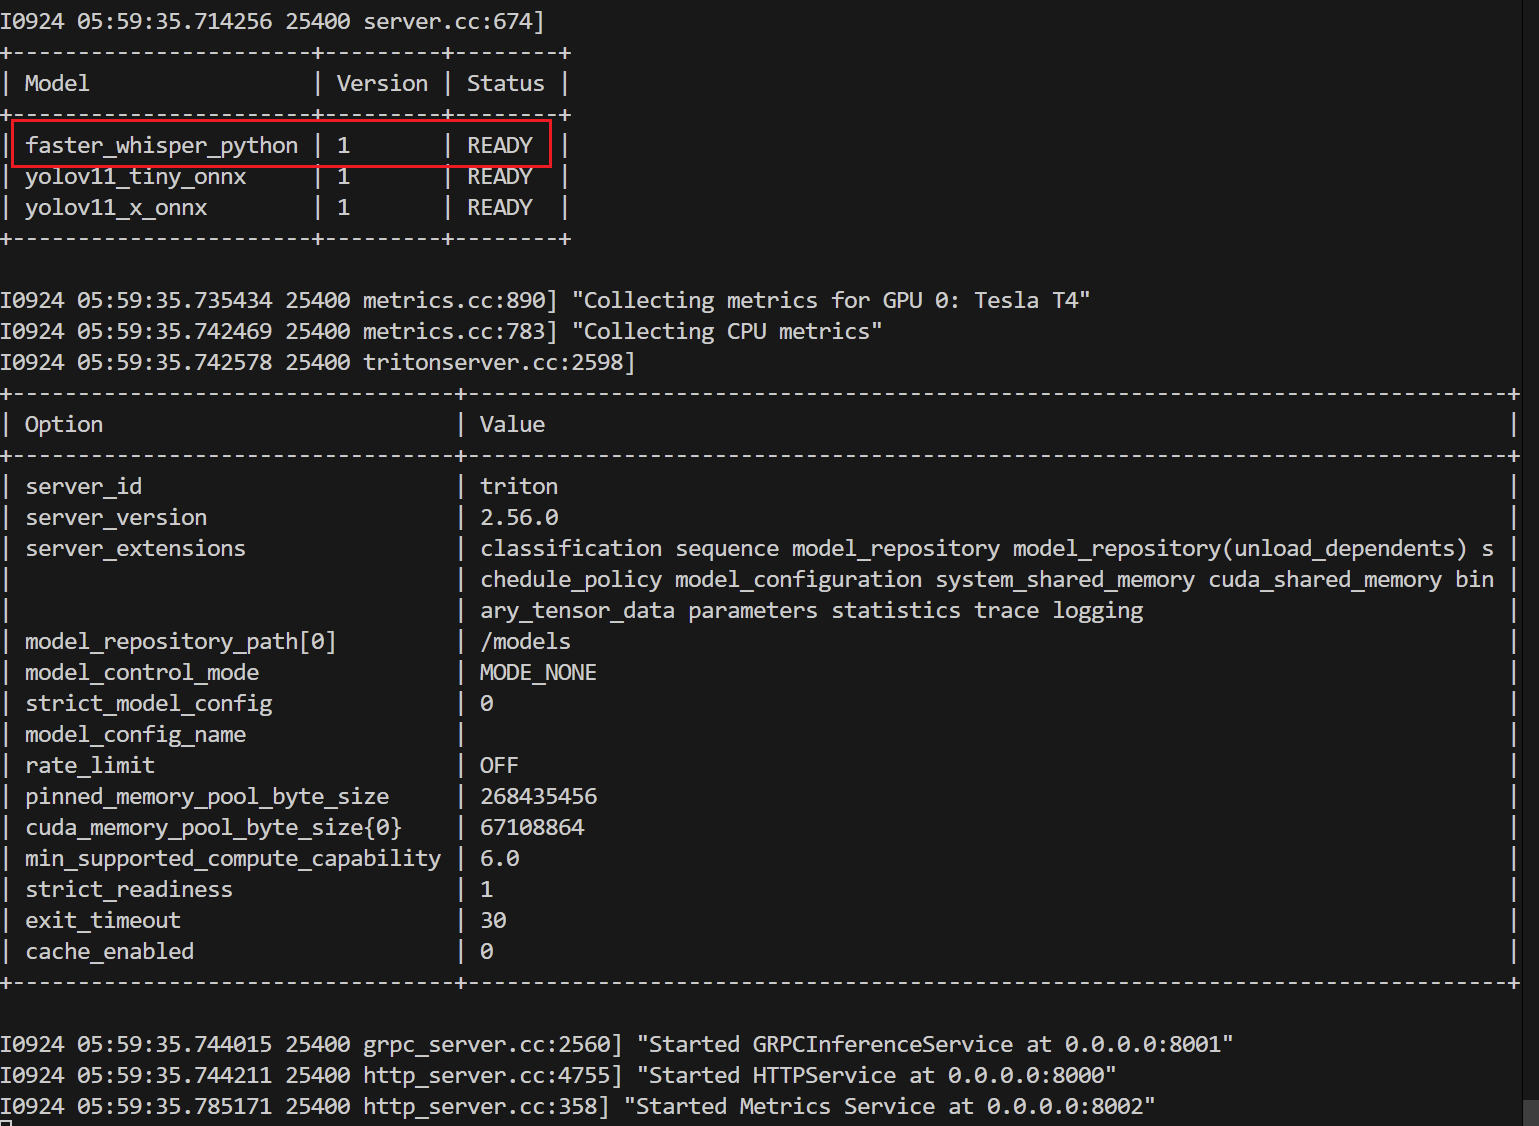
正确启动服务:
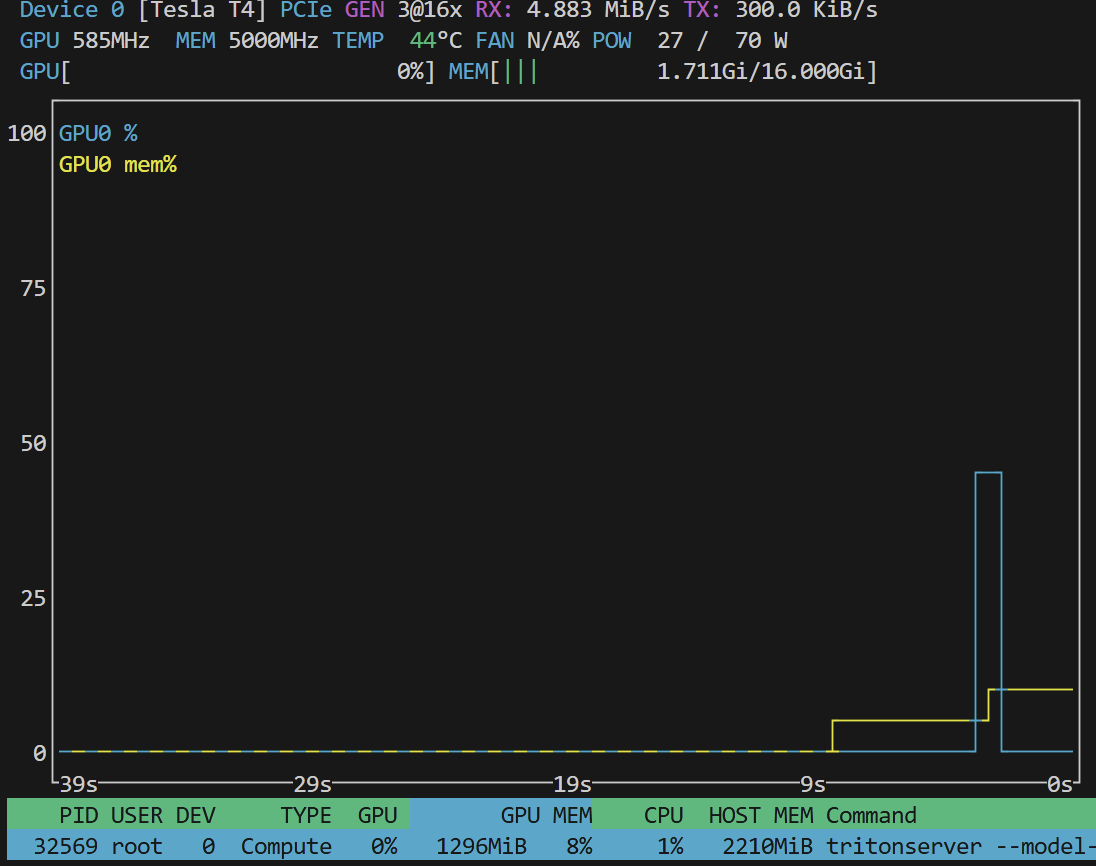
- 服务加载到GPU上
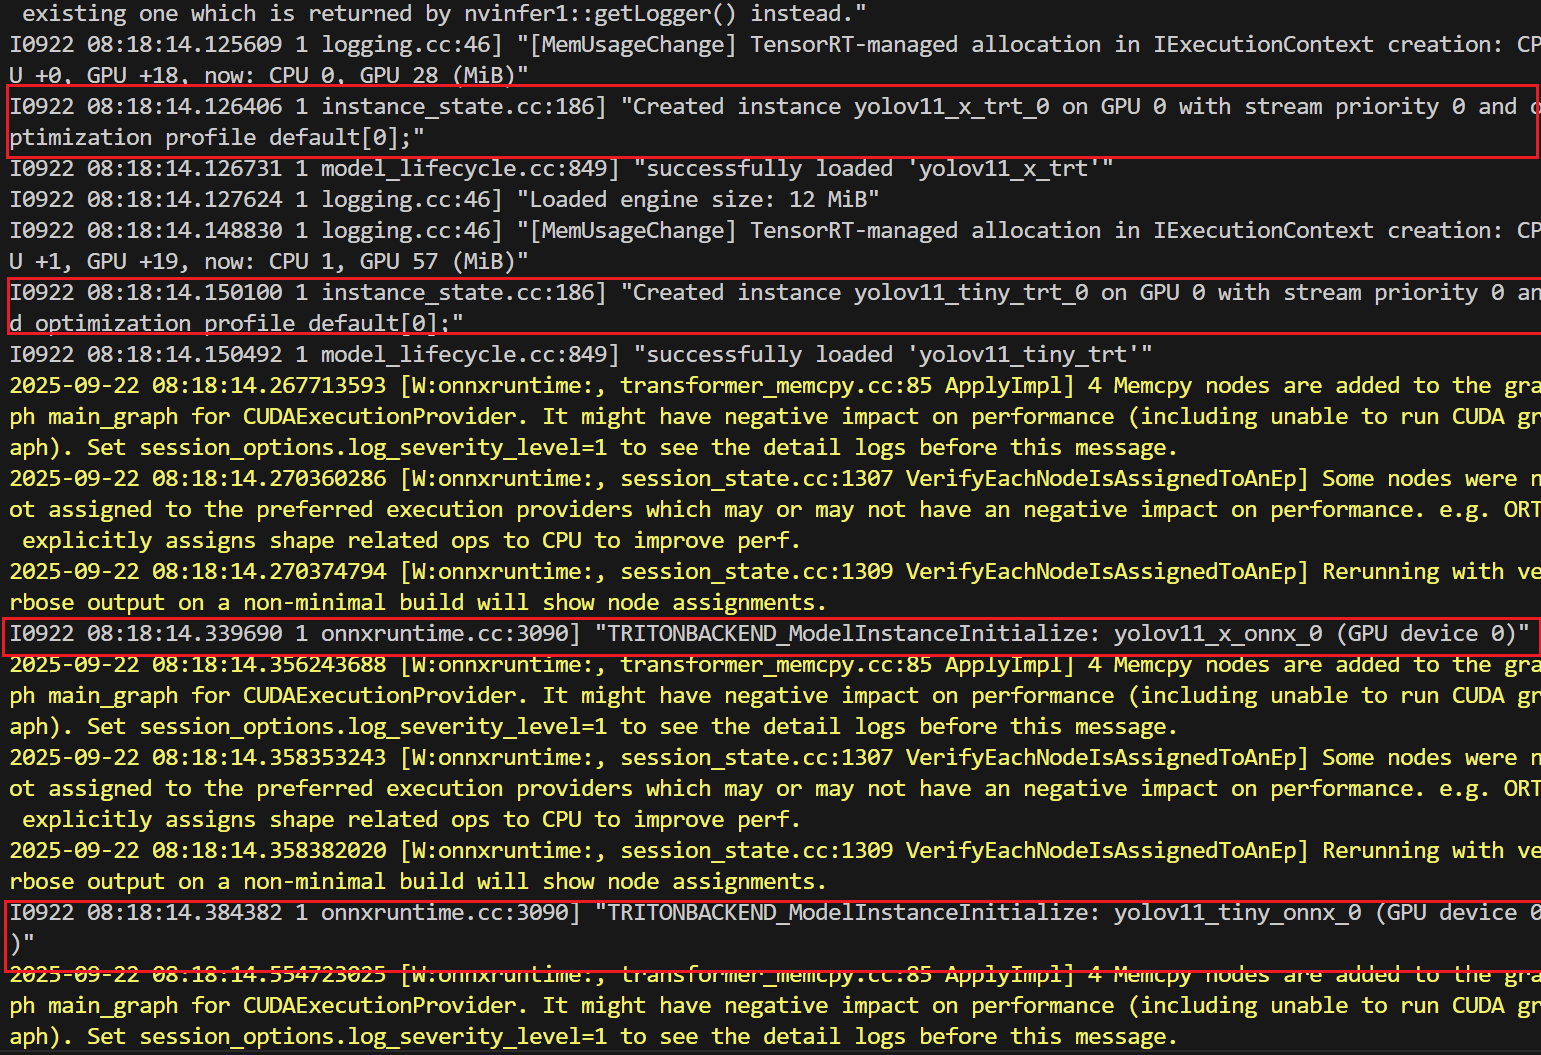
- 服务正常启动
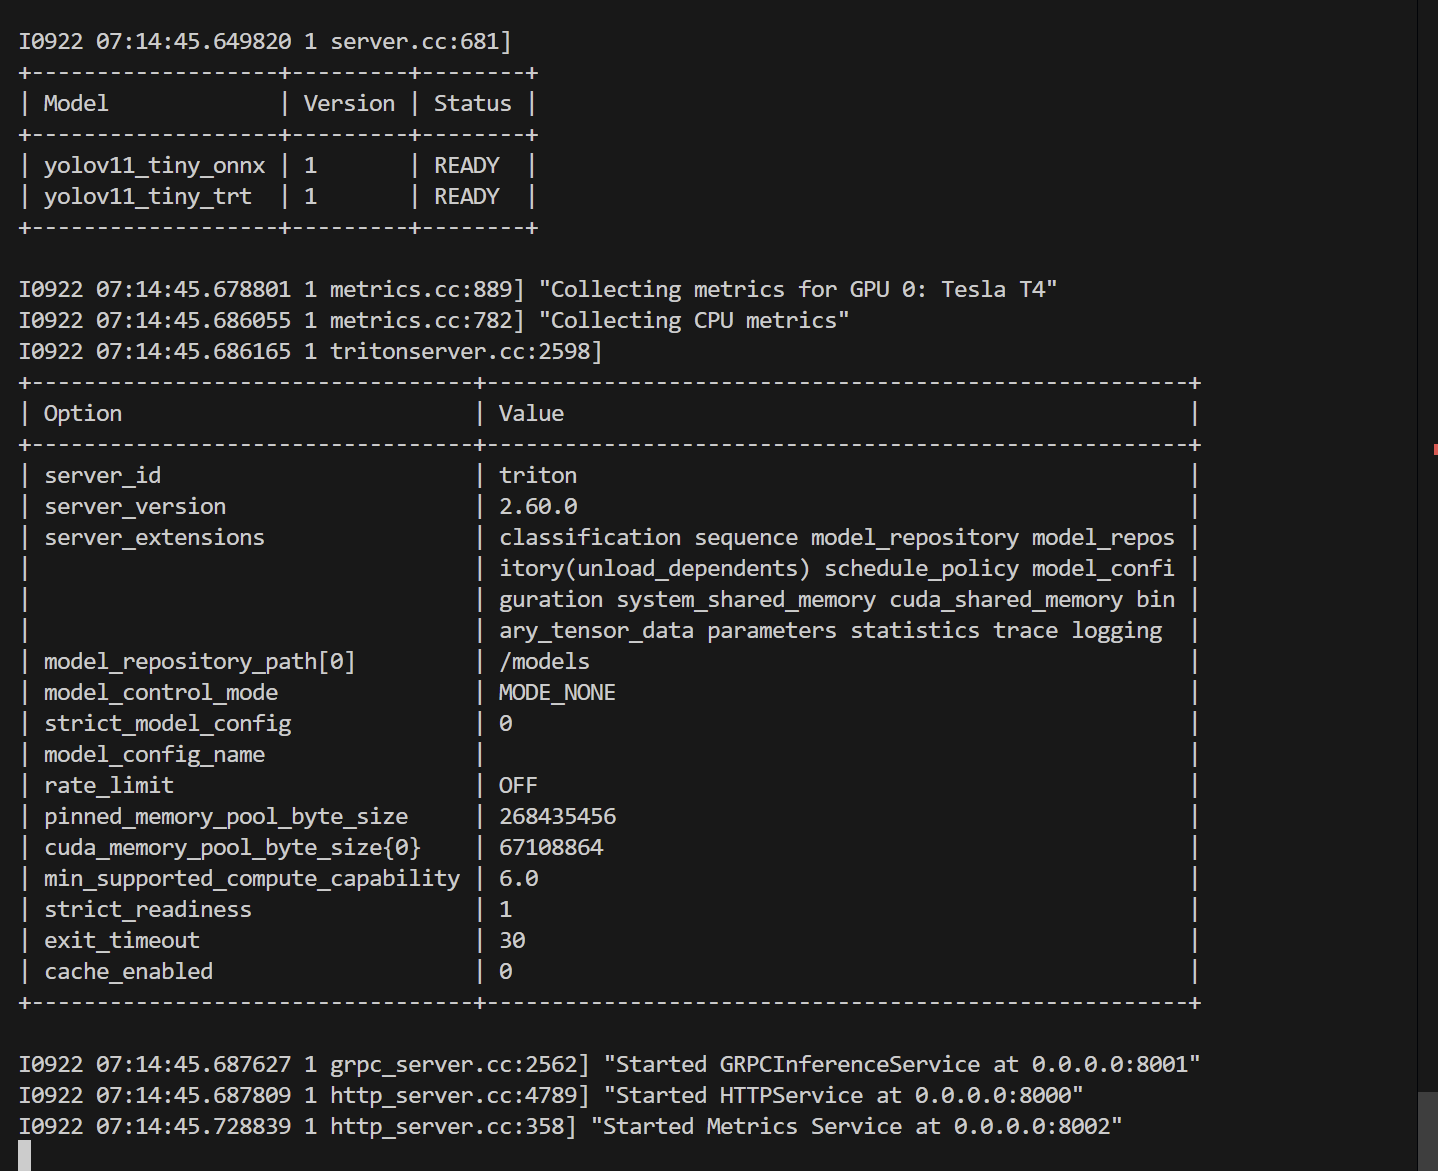
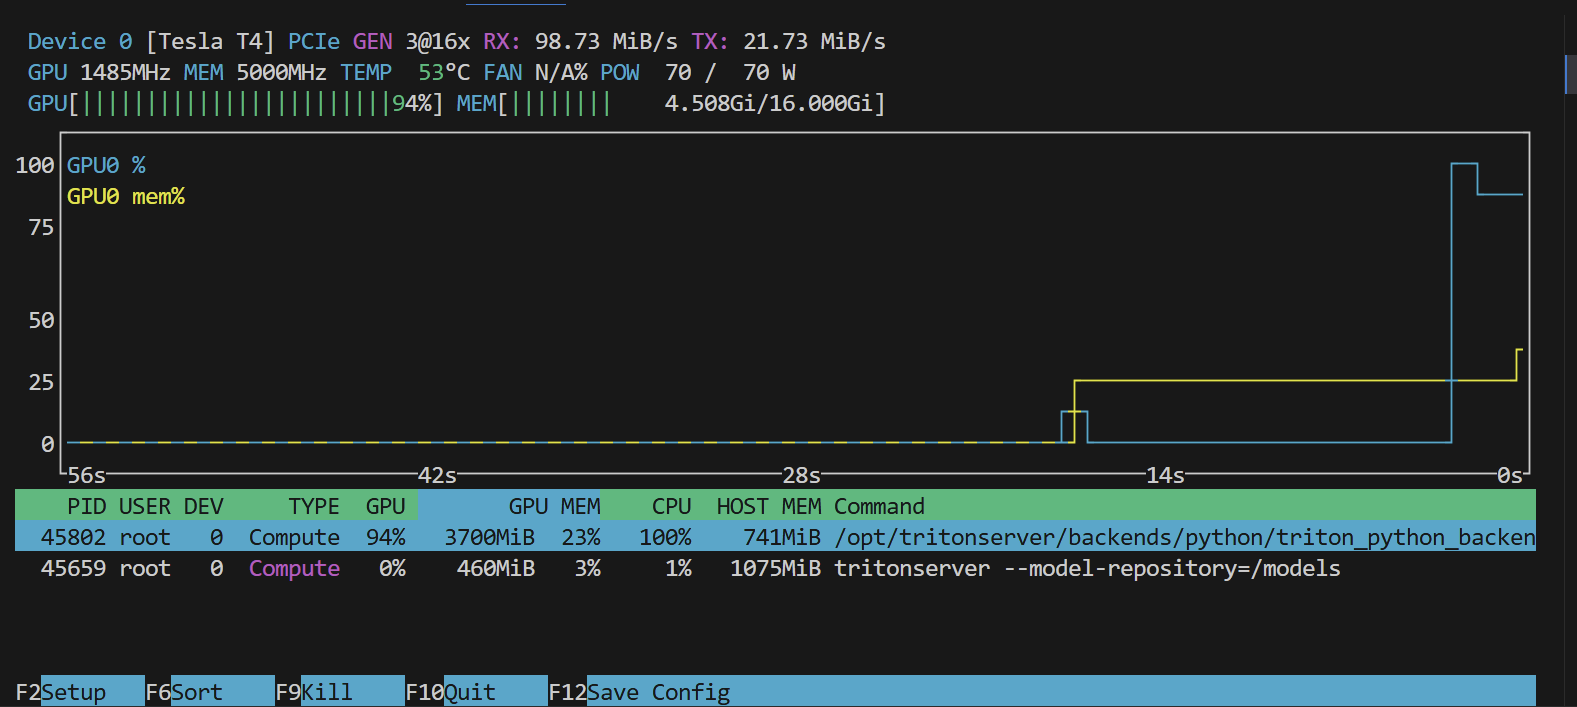
- gpu情况
onnx 模型
我导出的 onnx 相关的信息
https://github.com/Akabane71/triton-learn-note/blob/main/yolo-project/check_onnx.py
ONNX IR version: 9
Producer name: pytorch
Producer version: 2.8.0
Opset imports: [version: 19]
导出成onnx模型
yolo export model=yolo11n.pt format=onnx
使用 netron 查看
netron yolo11n.onnx
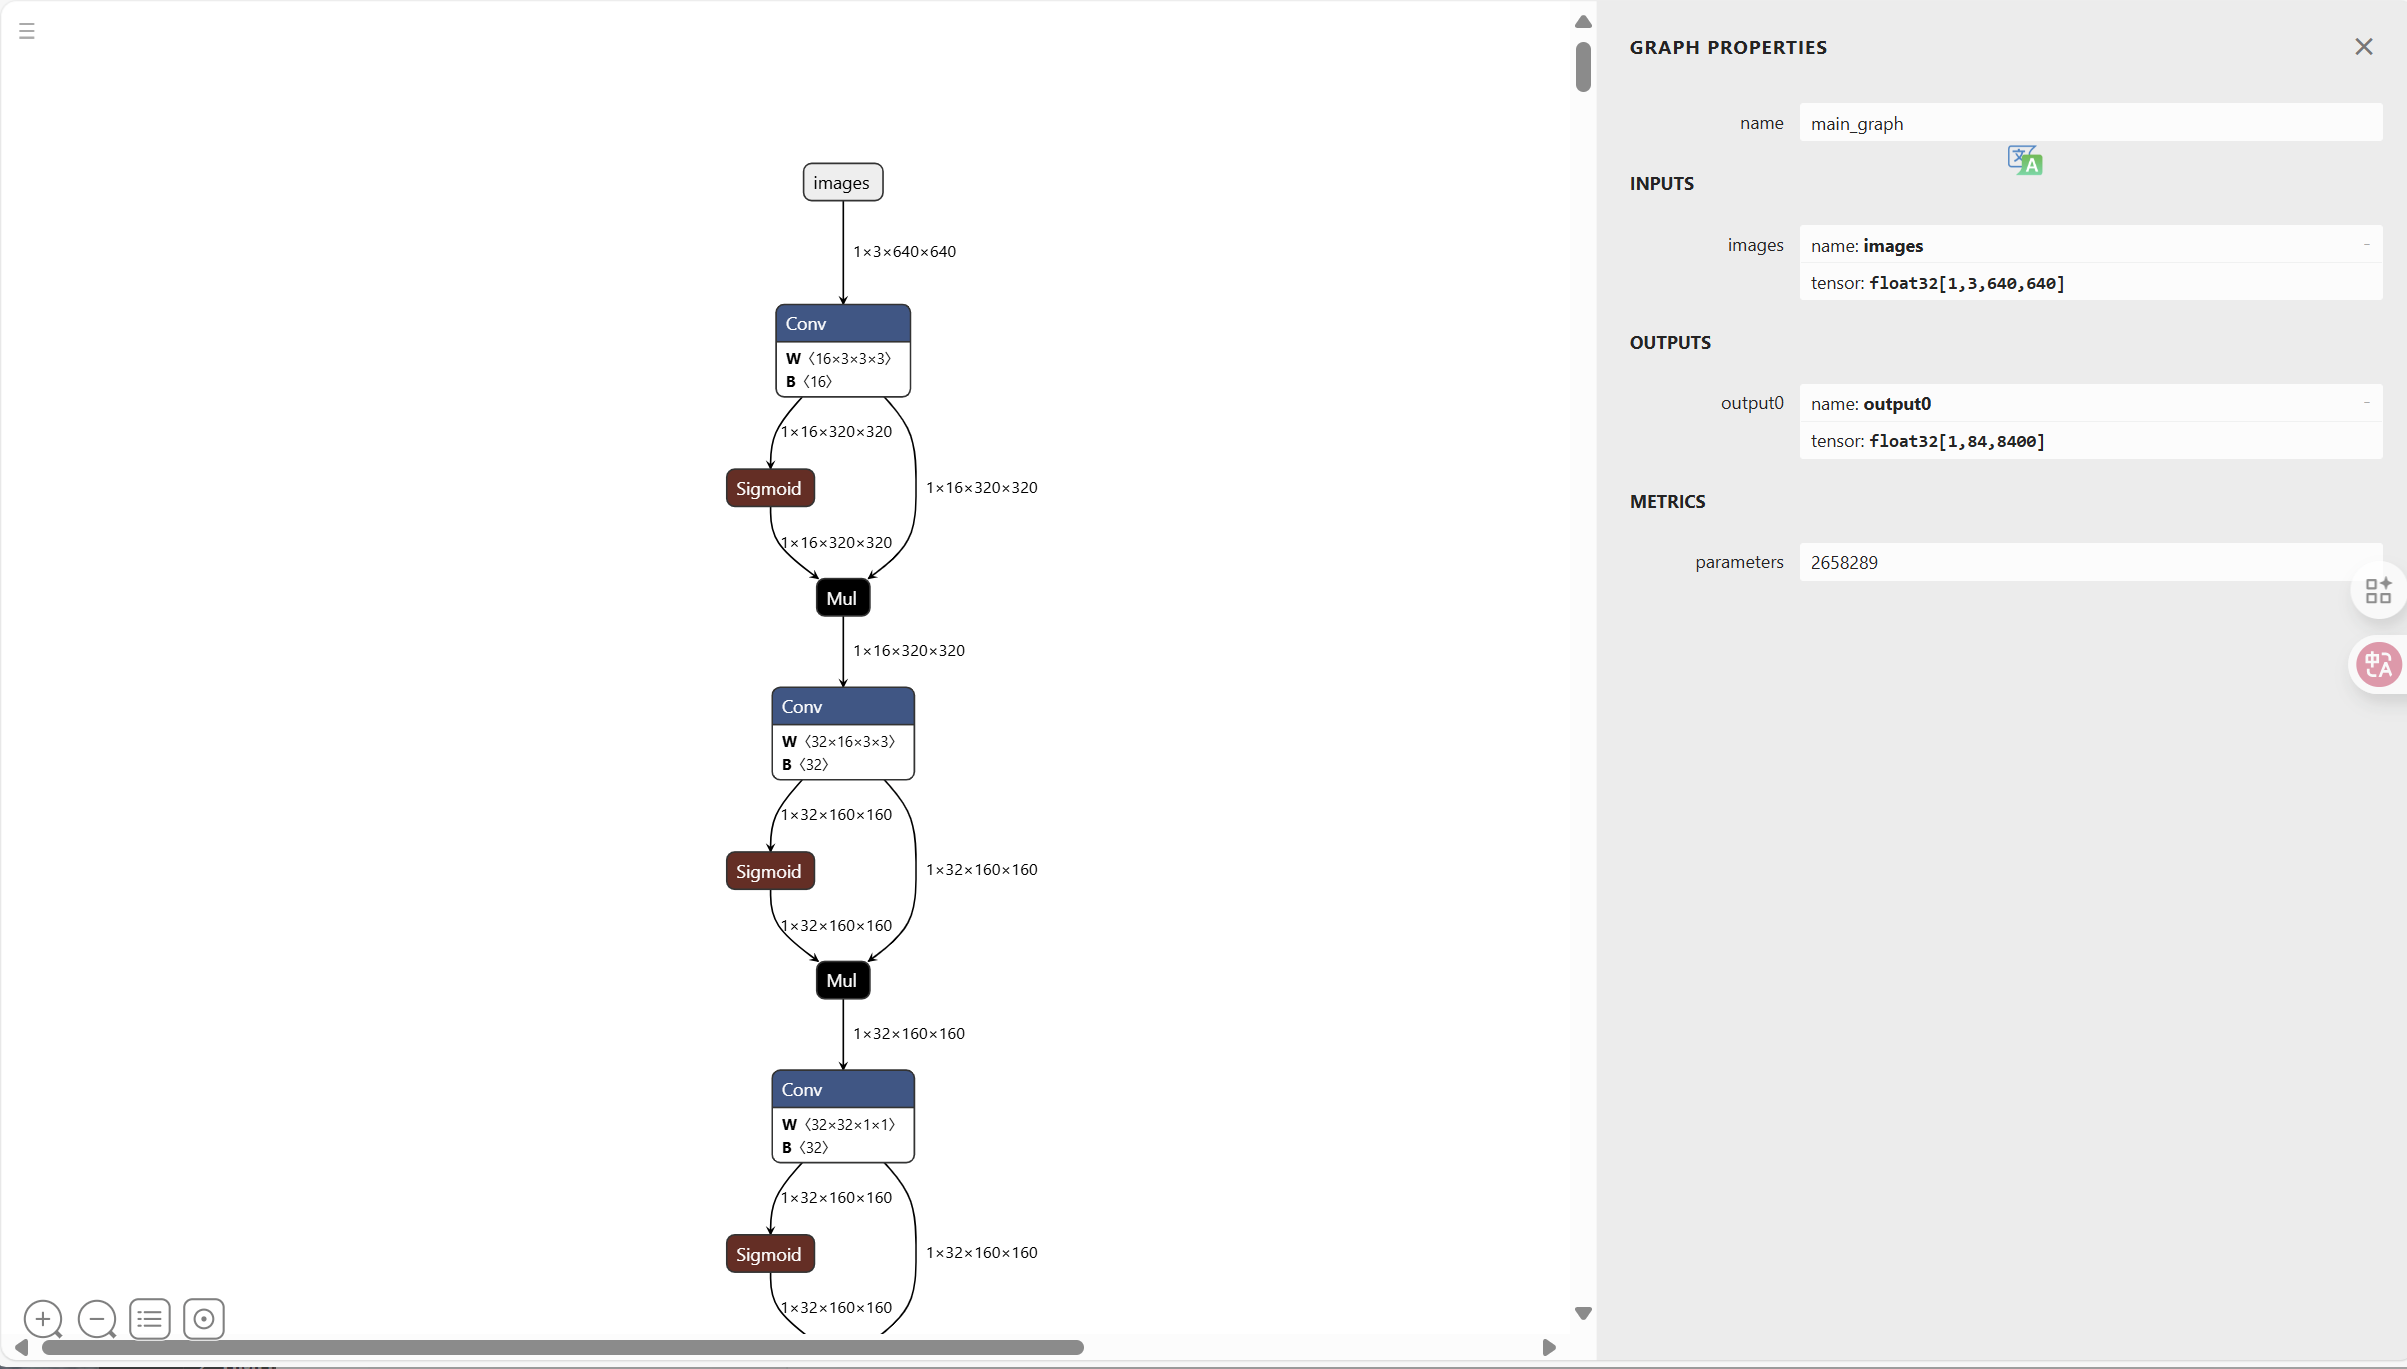
onnx的推理效果大概为:

trt 模型
本地tensorRT环境并本地导出就不演示了
推荐使用容器来构建
docker pull nvcr.io/nvidia/tensorrt:25.08-py3
模型挂载
docker run --gpus all -it --rm \
  -v $(pwd)/models:/models \
  nvcr.io/nvidia/tensorrt:25.08-py3
导出 trt engine:
trtexec --onnx=yolo11n.onnx \
        --saveEngine=model.engine \
        --fp16
查看模型:
trtexec --loadEngine=model.engine --verbose
模型的qps也帮你测出来了
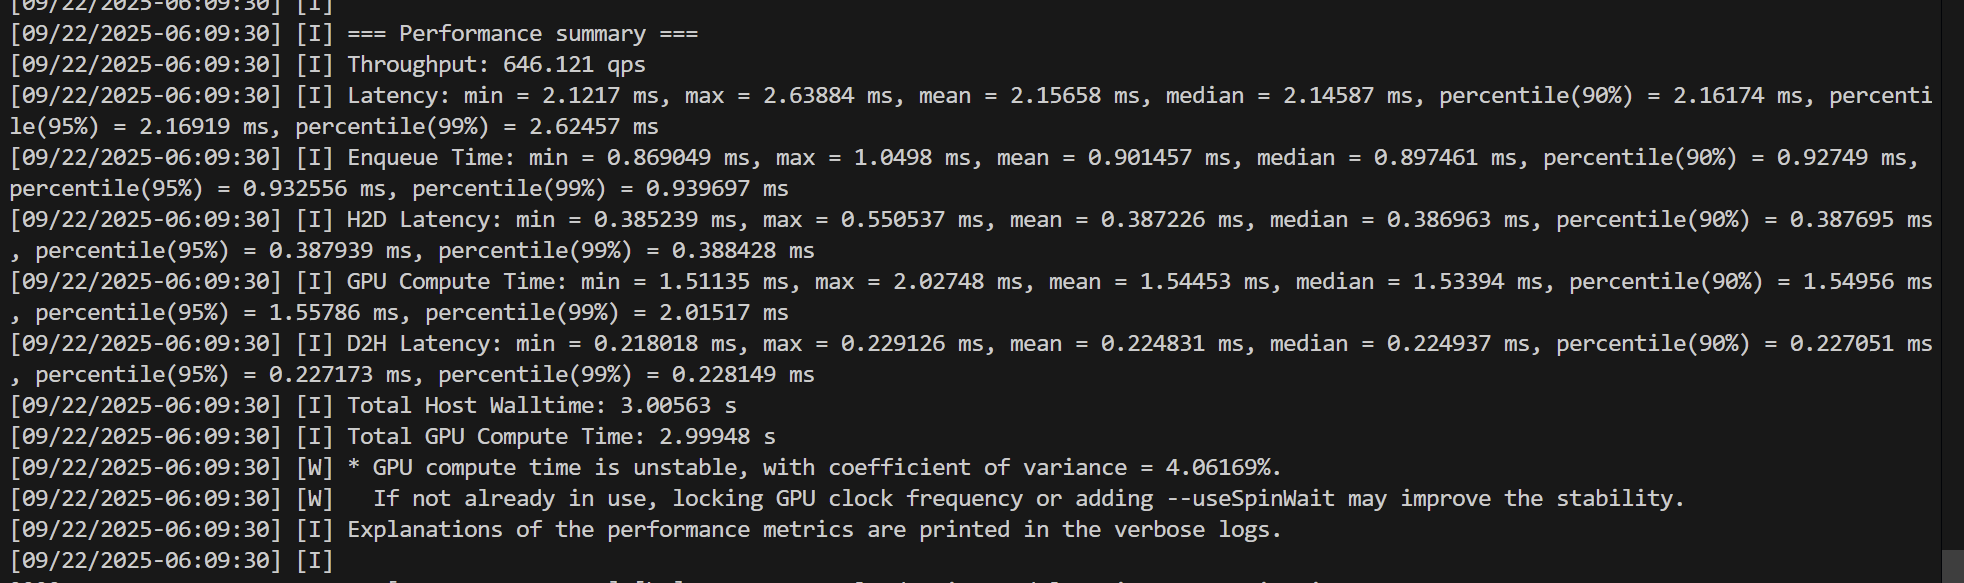
yolo的性能测试
使用 tritonserver sdk 版本,这个版本携带了测试工具
docker pull nvcr.io/nvidia/tritonserver:25.08-py3-sdk
# --network 借用宿主机的网络
docker run --gpus all --rm -it \
  --network host \
  nvcr.io/nvidia/tritonserver:25.08-py3-sdk \
  perf_analyzer -m yolov11_x_onnx -u localhost:8001 -i grpc


docker run --gpus all --rm -it --network host \
  nvcr.io/nvidia/tritonserver:25.08-py3-sdk \
  perf_analyzer -m yolov11_x_trt -u localhost:8001 -i grpc
我们测试最大的 yolov11_x_onnx 和 yolov11_x_trt
- yolov11_x_onnx
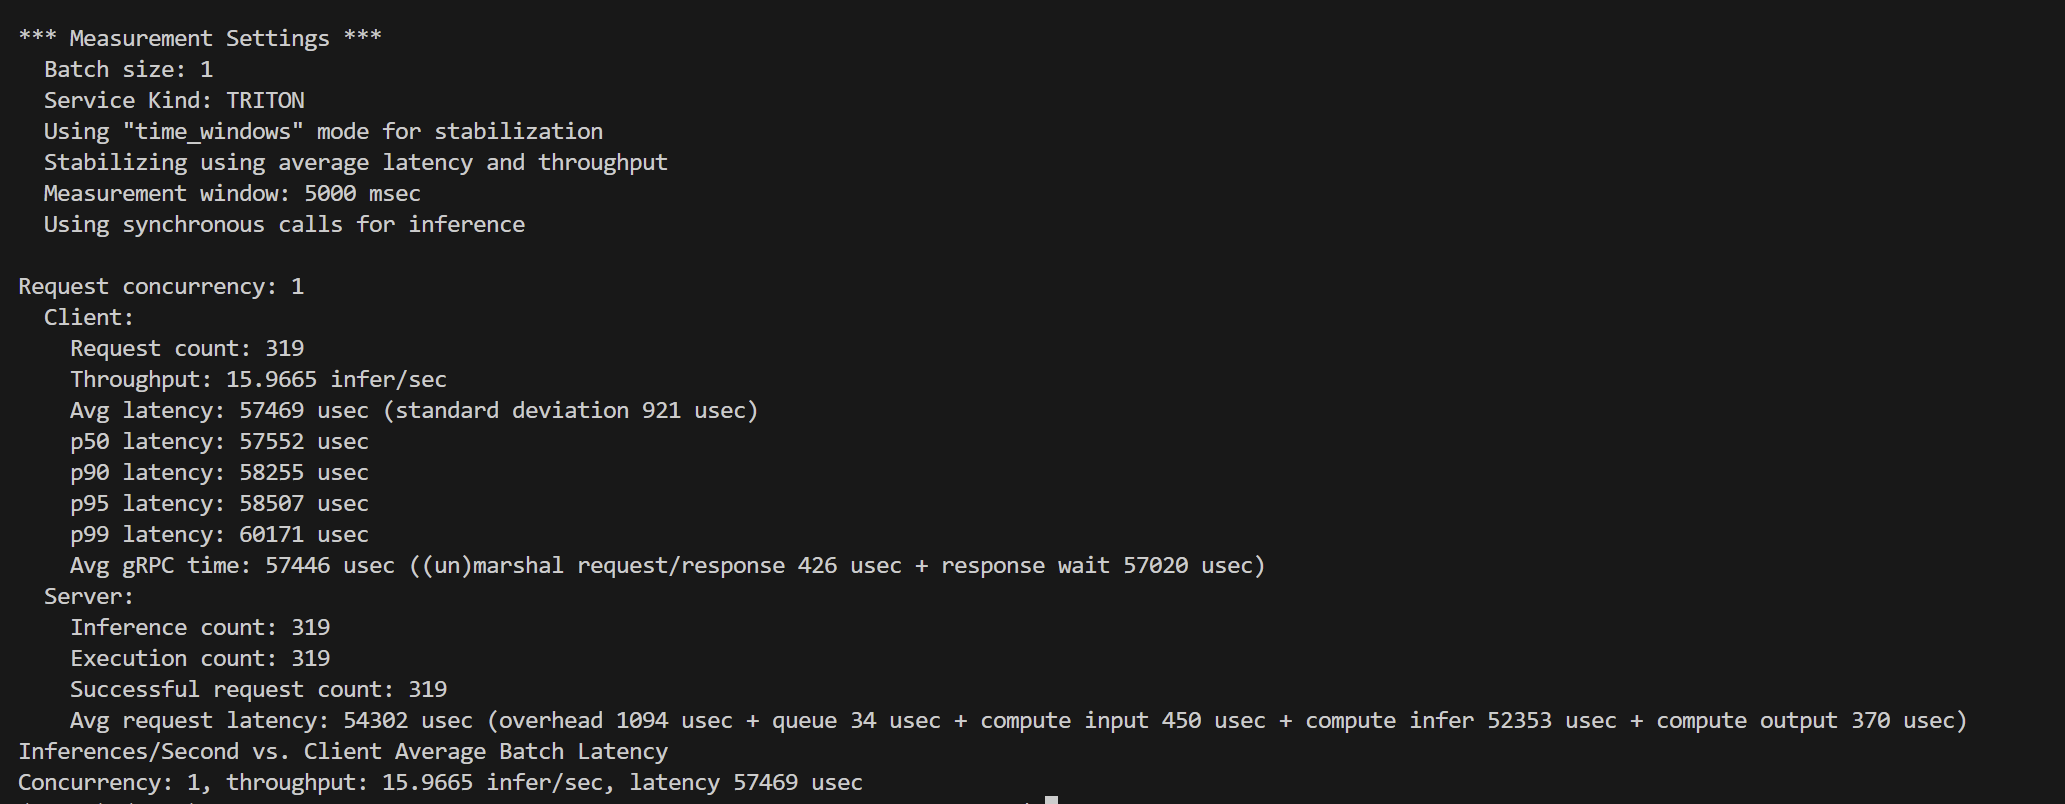
*** Measurement Settings ***
Batch size: 1
Service Kind: TRITON
Using “time_windows” mode for stabilization
Stabilizing using average latency and throughput
Measurement window: 5000 msec
Using synchronous calls for inferenceRequest concurrency: 1
Client:
Request count: 319
Throughput: 15.9665 infer/sec
Avg latency: 57469 usec (standard deviation 921 usec)
p50 latency: 57552 usec
p90 latency: 58255 usec
p95 latency: 58507 usec
p99 latency: 60171 usec
Avg gRPC time: 57446 usec ((un)marshal request/response 426 usec + response wait 57020 usec)
Server:
Inference count: 319
Execution count: 319
Successful request count: 319
Avg request latency: 54302 usec (overhead 1094 usec + queue 34 usec + compute input 450 usec + compute infer 52353 usec + compute output 370 usec)
Inferences/Second vs. Client Average Batch Latency
Concurrency: 1, throughput: 15.9665 infer/sec, latency 57469 usec
| 指标 | 数值 |
|---|---|
| Batch size | 1 |
| Concurrency | 1 |
| 客户端吞吐量 | 15.97 infer/sec |
| 客户端平均延迟 | 57.5 ms |
| p50/p90/p95/p99 | 57.6 / 58.3 / 58.5 / 60.2 ms |
| GPU推理耗时 | 52.3 ms |
| CPU/队列/IO开销 | <1 ms |
- yolov11_x_trt
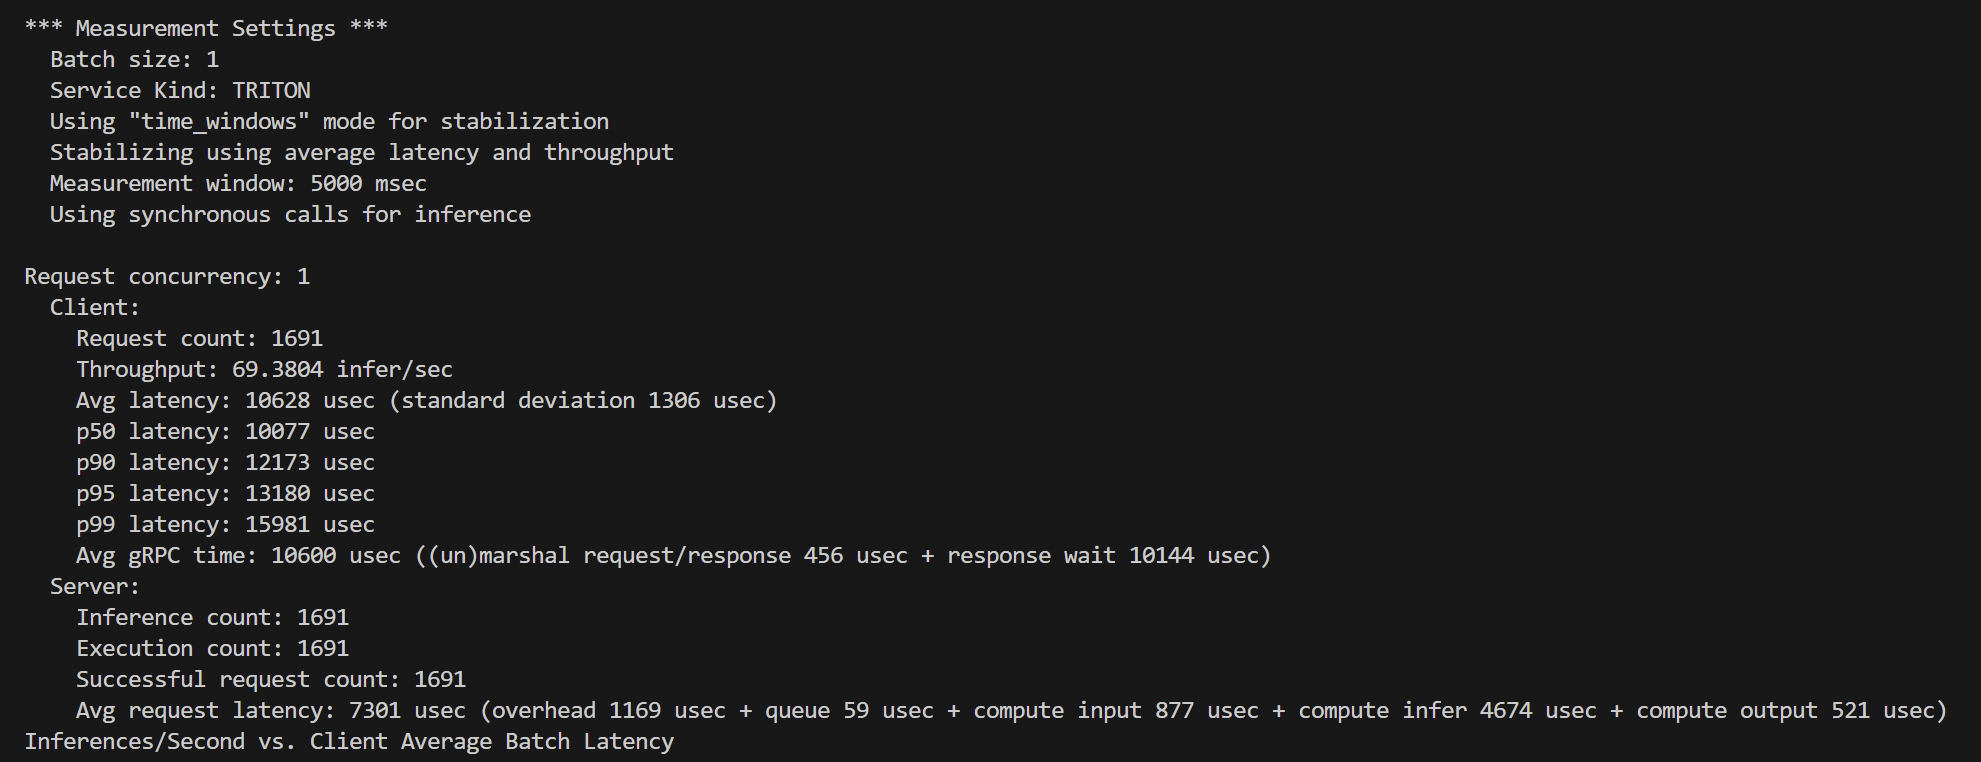
*** Measurement Settings ***
Batch size: 1
Service Kind: TRITON
Using “time_windows” mode for stabilization
Stabilizing using average latency and throughput
Measurement window: 5000 msec
Using synchronous calls for inferenceRequest concurrency: 1
Client:
Request count: 1691
Throughput: 69.3804 infer/sec
Avg latency: 10628 usec (standard deviation 1306 usec)
p50 latency: 10077 usec
p90 latency: 12173 usec
p95 latency: 13180 usec
p99 latency: 15981 usec
Avg gRPC time: 10600 usec ((un)marshal request/response 456 usec + response wait 10144 usec)
Server:
Inference count: 1691
Execution count: 1691
Successful request count: 1691
Avg request latency: 7301 usec (overhead 1169 usec + queue 59 usec + compute input 877 usec + compute infer 4674 usec + compute output 521 usec)
| 指标 | 数值 |
|---|---|
| Batch size | 1 |
| Concurrency | 1 |
| 客户端吞吐量 | 69.38 infer/sec |
| 客户端平均延迟 | 10.63 ms |
| p50/p90/p95/p99 | 10.08 / 12.17 / 13.18 / 15.98 ms |
| GPU推理耗时 | 4.67 ms |
| CPU/队列/IO开销 | ~1 ms |
总结
yolov11_x 在onnx 和 tensorRT 对比下,在 Tesla T4 显卡情况下,推理速度差距大约为 5倍
faster-whisper案例
我先试试 faster-whisper作为自定义后端看看能不能成功
我们先简单地来操作了,挂载模型和目录
docker run --gpus all -it \
    -p8000:8000 -p8001:8001 -p8002:8002 \
    -v $(pwd)/model_repository:/models \
    -v /home/azureuser/.cache/pip:/root/.cache/pip \
    -v /home/azureuser/.cache/uv:/root/.cache/uv \
    -v /home/azureuser/.cache/huggingface:/root/.cache/huggingface \
    -v $(pwd)/faste-whisper_src:/app \
    --name my_triton \
    nvcr.io/nvidia/tritonserver:25.03-py3-sdk \
    /bin/bash
faster-whisper使用的后端为 ctranslate2 ,主要对cuda toolkit 版本有一定的需求
使用cuda12x版本来会更加稳定
triton
文件目录belike:
./faster_whisper_python/
├── 1
│ └── model.py
└── config.pbtxt
- Server
https://github.com/Akabane71/triton-learn-note/blob/main/model_repository/faster_whisper_python/1/model.py
- Client
https://github.com/Akabane71/triton-learn-note/blob/main/faste-whisper_src/triton-client.py
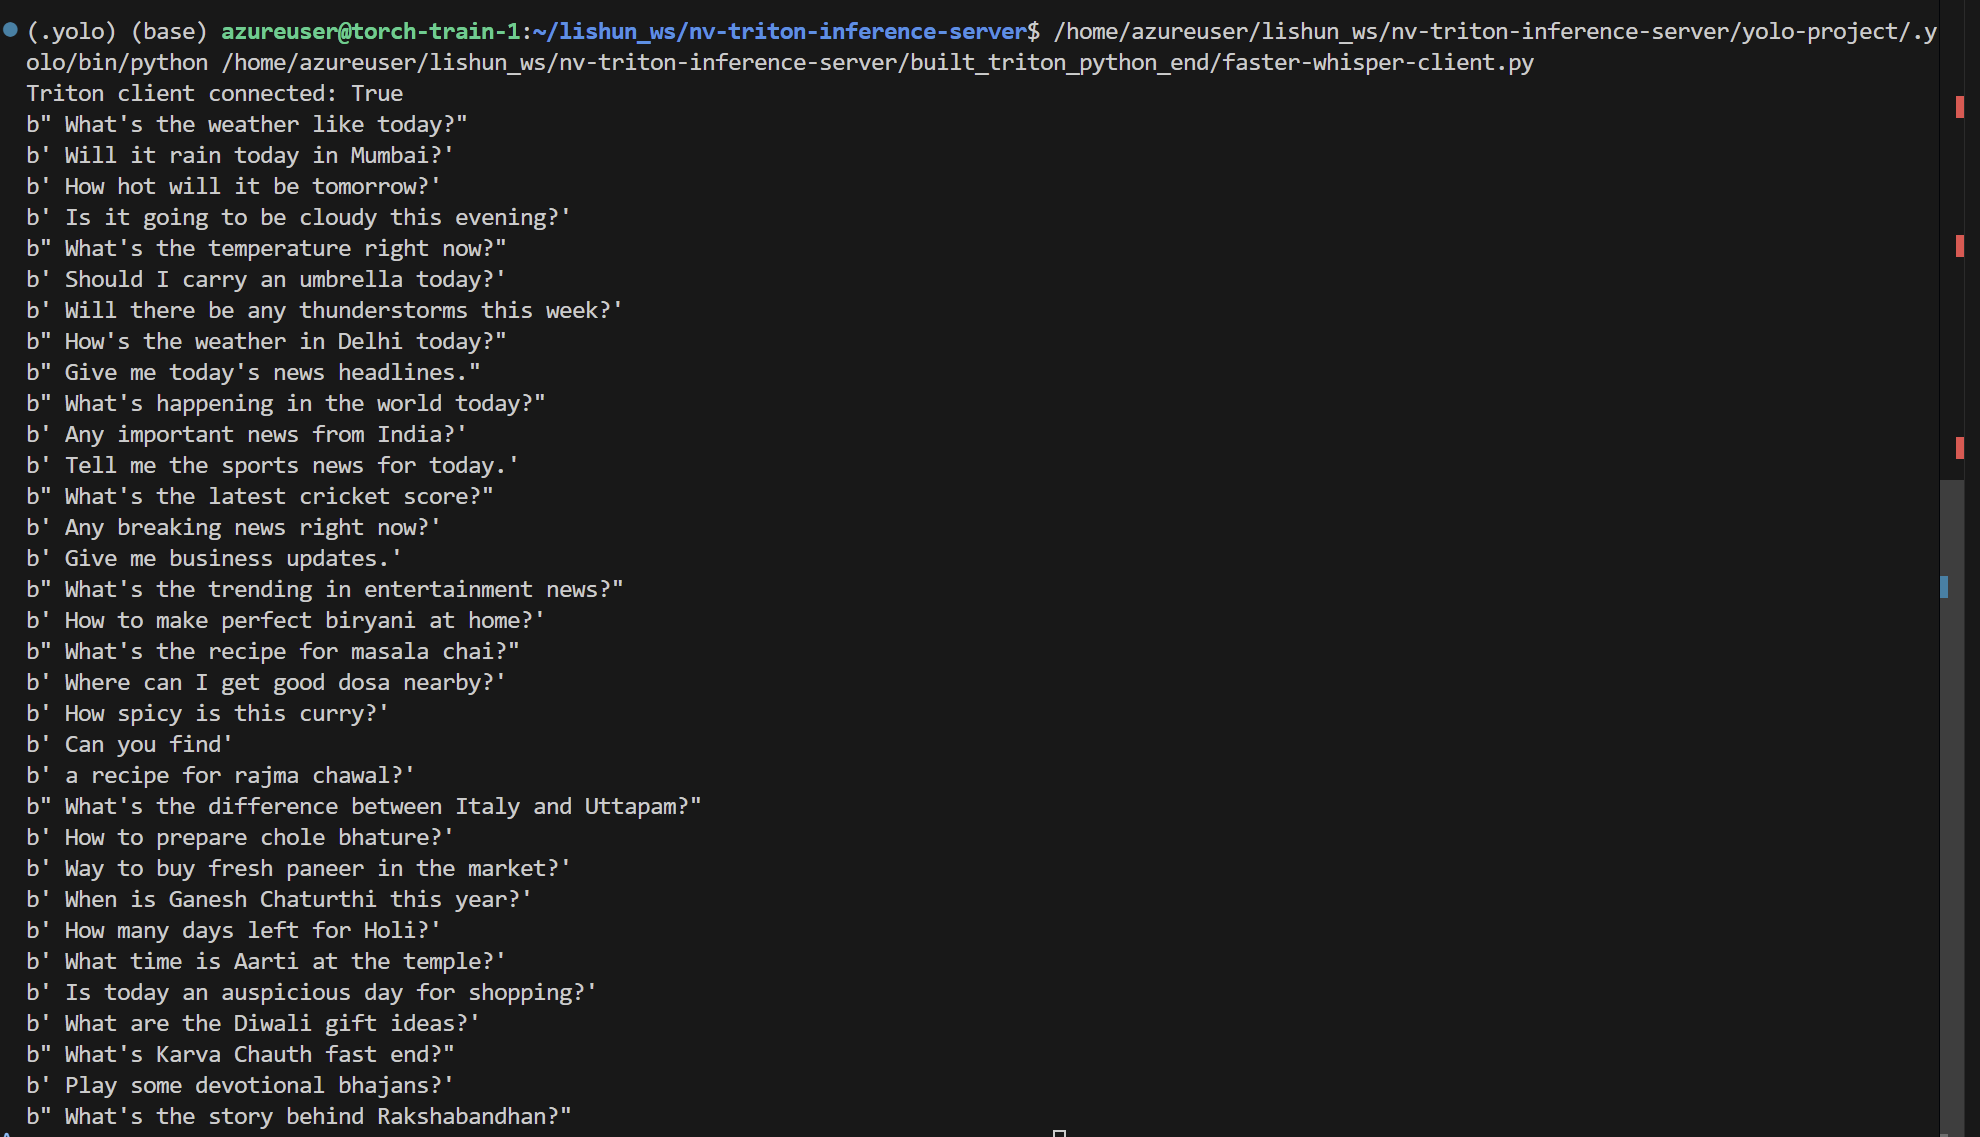
python后端是完美支持的